 Underwater with your mortgage? You’re not alone
Are you underwater with your mortgage? You’re not alone.
According to the latest figures from CoreLogic, 10.8 million, or 22.5 percent, of all residential properties with mortgages were in negative equity at the end of the third quarter of 2010, down from 11 million and 23 percent in the second quarter.
Unfortunately, the decrease in the number of homeowners who are underwater with their loans was due primarily to foreclosures of severely negative-equity properties rather than an increase in home values.
The CoreLogic Negative Equity Report shows that during 2010, the number of borrowers with negative equity declined by over 500,000 borrowers. An additional 2.4 million borrowers had less than 5 percent equity in the third quarter. Together, negative-equity and near-negative-equity mortgages accounted for 27.5 percent of all residential properties with a mortgage nationwide.
Here are some highlights from the third quarter report:
- Negative equity remains concentrated in five states. Nevada has the highest concentration of homes in negative equity, with 67 percent of its mortgage properties underwater. Just about a third of all residential properties in Nevada have some sort of equity. The other top four states are Arizona (49 percent of homes underwater), Florida (46 percent), Michigan (38 percent), and California (32 percent).
- The largest declines in negative equity were concentrated in the hardest-hit states. After Alaska, which had the largest decline in negative equity (falling 1.8 percentage points), the states with the largest declines were Nevada (-1.6 percent), Arizona (-1.4 percent), California (-1.2 percent), and Florida (-0.9 percent).
- Negative equity rose in Idaho and Alabama. These two states are at the top of the list for home price depreciation at the moment, so it makes sense that the number of homeowners whose properties are underwater is increasing.
- Many homeowners have significant equity. Nearly half of New York borrowers have 50 percent or more positive equity, which leads the nation, followed by Hawaii (43 percent), Massachusetts (40 percent), Rhode Island (40 percent), and Connecticut (39 percent).
- The homeownership rate is falling. According to the census, the Q3 2010 homeownership rate was 66.9 percent, down from a peak of 69.2 percent in Q4 2004. However, the census definition of homeownership includes homeowners with negative equity; if you remove all negative-equity homeowners, there is an effective homeownership rate of 56.6 percent, or 10 percentage points lower than the official rate.
- The amount of negative equity is falling. The aggregate level of negative equity declined to $744 billion, which is a 3 percent decline from Q2 2010 and a 7 percent decline from the end of 2009 (when it stood at $800 billion).
One of the most interesting findings is that the pre-foreclosure rate is higher for borrowers with more expensive homes (above $500,000) than for borrowers with low- to moderately priced homes (between $100,000 and $300,000). Interestingly, once these homeowners fall into deep negative equity, the relationship reverses, with the low- to moderately priced homes exhibiting fairly higher pre-foreclosure rates (figure 6).
“Negative equity is a primary factor holding back the housing market and broader economy. The good news is that negative equity is slowly declining, but the bad news is that price declines are accelerating, which may put a stop to or reverse the recent improvement in negative equity,” said Mark Fleming, chief economist with CoreLogic.
READ MORE:
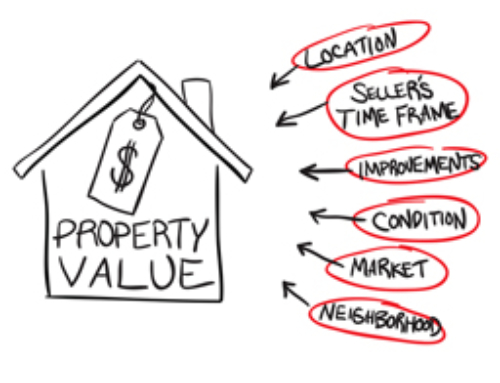
The Best Way To Value Investment Property
How to Find a Great Real Estate Agent
Will the Real Estate Summer Slowdown Mean Lower Prices?
No More Home Buyer Tax Credits: Is Now a Good Time to Buy a House?