In the go-go housing market that prevailed leading up to 2008, many people came to believe that they couldn’t go wrong investing in a home (i.e., buying a house and throwing as much money as possible into maintaining and improving it). When home prices were rising steadily—one could say precipitously—for nearly 35 years leading up to the recession, owners were almost certain to cover their costs and make tidy profits on virtually any home improvement investment.
That was then; this is now. Since the Great Mortgage Meltdown, investing in a home has been anything but a sure bet. In most parts of the U.S., home prices quickly fell to pre-2001 levels after the housing bubble burst. During the last year or two there’s been a leveling off, and perhaps even a slight recovery, but credit remains tight, home sales are constrained, and the potential downside of investing in a home and making home improvements is coloring the national outlook for the foreseeable future.
Cost vs. value of home improvements in the national market
The “2014 Cost vs. Value Report” is the latest installment of an annual study published jointly by Remodeling magazine and Realtor magazine. It looks at more than 30 common home improvement projects, posts data on their average costs in markets nationwide, and projects how much of their investment owners would likely recover when they sell their improved homes.
The table below lists five projects that yield the highest return on investment (ROI) when the entire U.S. is viewed as a single market.

Regional views of the cost vs. value of home improvements
From a national perspective, it looks like only one of the top five projects would yield a profit, while the rest are unlikely to break even—not good news for would-be home improvement investors. But this data set doesn’t tell the whole story. For one thing, there is no national market for homes and home improvements. Like politics, all real estate markets are local. The “Cost vs. Value Report” divides the national data into nine individual regions:
- East North Central
- East South Central
- Middle Atlantic
- Mountain
- New England
- Pacific
- South Atlantic
- West North Central
- West South Central
Comparing the payback for the top projects in the national rankings to the ROI for the same projects in the Pacific region, which includes California, Oregon, Washington, Alaska, and Hawaii, gives a much different, more encouraging view of the potential value of home improvements within that region.

In the Pacific market, the order of the rankings changes slightly, and all but one of the nationally ranked projects should do better than break even. Although they’re not shown in the table, window replacements and basement remodels join the list of break-even (or better) projects for the Pacific region.
The value of home improvements through a local lens
The report also hones in on population centers within each region for truly local views. Within the Pacific region, for example, one can look at the data for San Francisco.

In this view, the rankings change order, and in this place the ROI for home improvements soars. If you were to look at the complete list of projects treated in the report, you’d see that in San Francisco, virtually any improvement would yield at least a 90 percent return, and most would return handsome profits.
Of course, that’s not the case everywhere. If it were, the national cost vs. value chart wouldn’t look as it does. The point is that from an investment standpoint, homeowners ought to consider carefully the costs and likely returns in their local market for projects they’re considering. The “Cost vs. Value Report” is a useful tool in this process.
DIY and ROI
It’s important to note that project cost estimates in this report include professional labor, which as a rule of thumb, generally constitutes at least two-thirds of the total project cost. In addition, the contractor’s overhead and profit generally accounts for 20 percent of the total. Any investment of sweat equity—doing whatever part of a job you can competently manage yourself—will reduce costs and improve ROI.
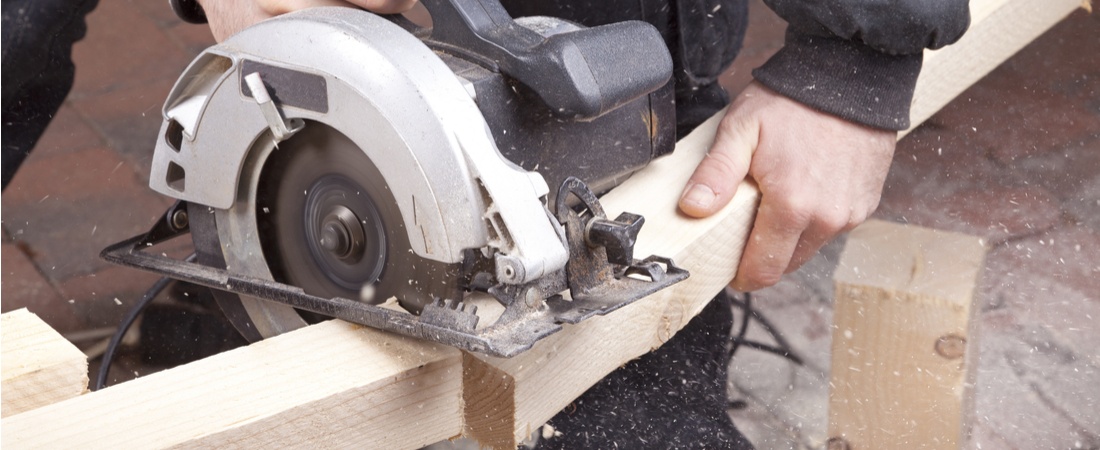
Among the top payback projects, it’s only a day’s work to remove an old, shabby-looking entry door and replace it with a modern pre-hung unit. All you’re likely to need is a pry bar, a drill/driver, a reciprocating saw, and a hammer.
Take a few weekends this summer to build a deck. It can be a great bonding experience if you enlist friends and family, and the money you save on professional labor will go right into your pocket when you sell.
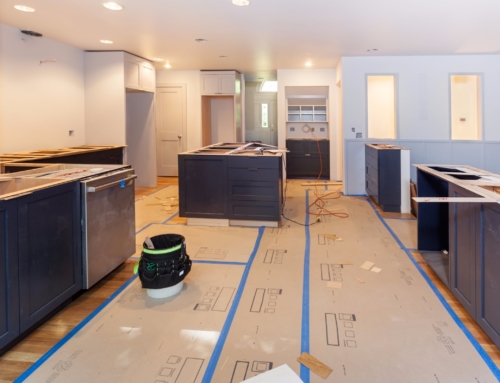
For a minor kitchen remodel, you might not have what it takes to make new cabinet fronts, but you can probably install them, along with new appliances and lighting with some hand tools, a drill driver, and a few clamps. Cha-ching!
While it’s important to hire a skilled contractor for certain projects, mitigating at least part of the cost by doing some of the work yourself can help improve your ROI when it comes time to sell your home.
Michael Chotiner is a DIY expert who writes about home improvement projects and the tools to use for them for Home Depot. Michael is also a licensed real estate agent in the Washington, DC, area. To view the power tools available at Home Depot for DIY projects, you can visit the Home Depot website.
[amazon_link asins=’1524763438,B0769ZVNR4,B004LQ1RGA,B00HRYBYRU’ template=’ProductCarousel’ store=’thinkglink-20′ marketplace=’US’ link_id=’dd484ebb-1653-11e8-ac6e-a796917efde9′]