
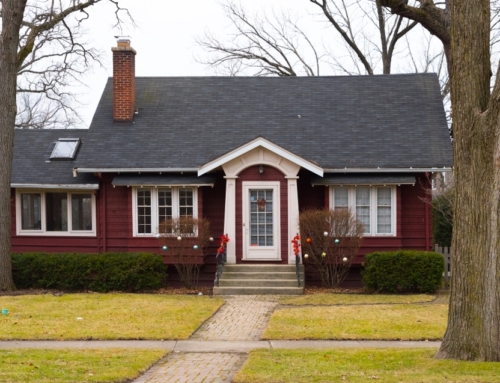
Record highs and lows in home sales during the second quarter in 2018 will make you think twice about buying and where the real estate market is headed.
The latest from ATTOM Data Solutions, curator of the nation’s premier property database, reviews reports on sales in the second quarter of 2018. Similarly to my last update on the housing market in May, there’s a combination of positive and negative signs.
Oddly enough, for single-family homes and condos, the median selling price of $255,000 was up 6.3 percent from a year ago to an all-time high. That’s 6 percent above the pre-recession peak of $241,648 in the third quarter of 2005.
That’s good news, but it also highlights a gap in different metro areas. Sales in metro areas like Houston and Denver were close to 80 percent above their pre-recession peaks while sales in Atlantic City, and York, PA were more than 30 percent below pre-recession peak.
Median home appreciation might be down, but for homes selling above $1 million, the median price-per-square-foot appreciation increased 5.4 percent. Areas like San Jose and Seattle benefitted from the acceleration, but Los Angeles and Manhattan actually decelerated price-per-square-foot when compared to 2017.
Home sellers in the second quarter of 2018 took home an average $58,000 more than their original purchase price, the highest average home seller price gain since Q3 2007. That’s an average 30.2 percent return on the original purchase price, up from an average 28.9 percent return in the first quarter but down from a recent peak of 30.8 percent in the fourth quarter of 2017. It’s no surprise that areas where price-per-square-foot accelerated most, like San Jose and Seattle benefitted with the highest home seller gains.
Sales of bank-owned homes, short sales and sales to third-party investors at foreclosure auctions (also known as distressed sales), dropped to an 11-year low. Distressed sales accounted for 11.9 percent of all single-family home and condo sales in the second quarter of 2018. New Jersey, Delaware, Rhode Island, Connecticut and Illinois had the highest share of distressed sales. Nearly 20 percent of sales in these states were distressed.
There’s been a lot of flux in the housing market this year with record highs and record lows. What do you think we’re going to see in the third quarter of 2018?


Leave A Comment